


Solcast - Historical and TMY Software
Historical time-series solar irradiance and meteo data, globally, in PVSyst, TMY3 and SAM formats.
-
Most popular related searches
Proven, Accurate, Bankable Data:
Solcast has been on a mission to advance the state of the art in cloud and radiation modelling.
Our team of meteorologists, data scientists and engineers started in 2015 by building the most sophisticated global real time irradiance service (the Solcast API), in concert with radiation modelling expert Dr Nick Engerer and his team of scientists from the Australian National University. After the API became operational (now with over 3,000 users globally and growing), Solcast’s meteorologists and data scientists moved focus to the history of satellite and aerosol data globally - with the goal of applying their improved technology to produce the most accurate, lowest uncertainty historical irradiance estimates.
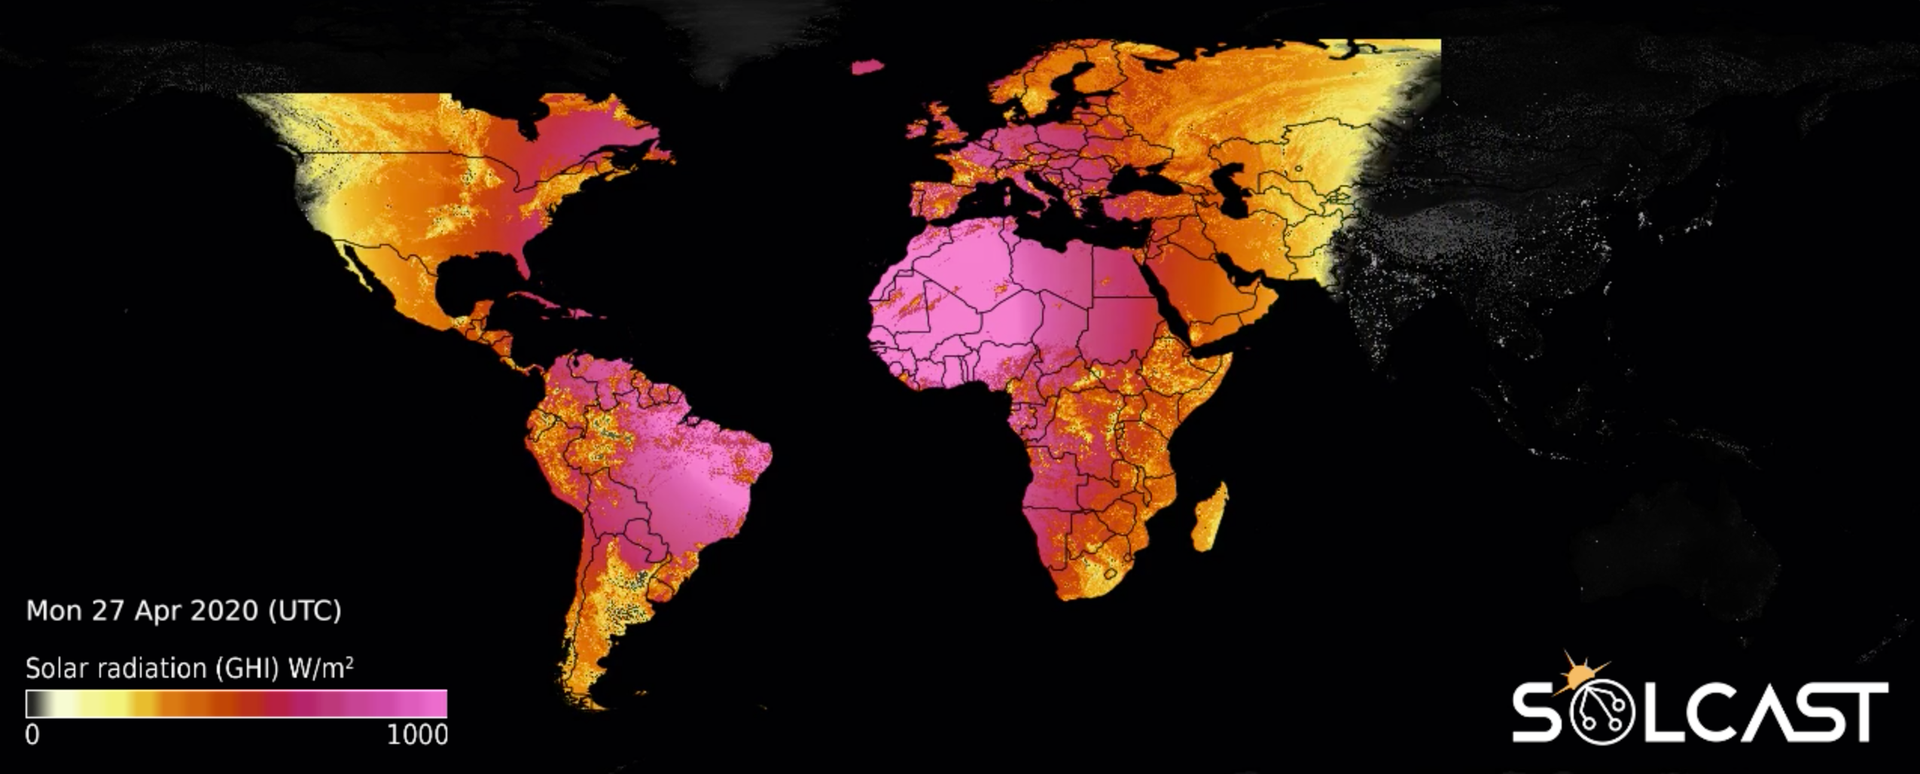
Using the highest resolution satellite and aerosols data, we detect our own clouds with industry-leading models. Our dataset reduces risk for developers, and lowers uncertainty in energy simulations by accurately modelling solar irradiance and weather data for 12+ years. Our solar data is available as Time Series, Typical Meteorological Year (TMY), and Monthly averages.
Data and Specifications:
Solar resource and weather data in time series, typical meteorological year (TMY) and monthly averages
Evaluating the solar resource is crucial for any solar energy investment decision. Project developers, technical consultants, and asset managers require reliable data to make informed, high-value, low-risk decisions.
Not all satellite-derived solar irradiance data is created equal. Solcast data has very low uncertainty, is delivered rapidly (in minutes), is available in multiple formats, and includes free credit to get you started.
Solcast produces three types of solar resource and weather data: Time Series, Typical Meteorological Year (TMY), and Monthly averages. Sign up using the Solcast toolkit and get free credits so you can download some sample data, that’s relevant for you, for free, right now.
TMY
A TMY, or Typical Meteorological Year, is a collation of historical weather data for a specified location for a one year period. The dataset is derived from a multi-year time-series specifically selected so that it presents the unique weather phenomena for the location, and provides annual averages that are consistent with long term averages. All TMY files contain exactly 8760 rows of data, each corresponding to an hourly period in an ‘average’, or ‘typical’ year. TMY data is frequently used by solar engineers, as a data input to energy system simulations.
Solcast offers two variants of TMY: Basic (P50 only) and Extended (P50, P75 & P90). See details on the Solcast pricing page
Inputs and Algorithms
Solcast has spent four years developing a system to produce data with very low bias and error, providing you with the lowest uncertainty, and the most “bankable” data possible. Our database lowers risk for developers, operators, and investors, ensuring decisions on the development or operation of high-value solar assets are made confidently.
Solcast’s global solar database is produced using high-resolution (1-2km) imagery from a range of geostationary meteorological satellites, from which we diagnose our own clouds using an innovative 3D approach. The data is created using a combination of peer-reviewed, industry-standard models, and algorithms developed in-house. Read more about how we make our data here, and test for yourself against your own ground measurements using the free data credits you receive when you register.
Solar Irradiance Modeling
The Solcast method for estimating solar irradiance from geostationary weather satellites consists of three major steps. First is the detection of cloud cover and the characterisation of that cloud cover in terms of its impact on solar radiance. Second is modeling the available solar radiance under clear skies, including treatment of aerosols (dust, salt, etc.) and water content. And third is the final, combined estimate of the amount of solar irradiance reaching the Earth’s surface after it passes through the clouds (if any are present).
Methodology
DETECTING CLOUD COVER AND THICKNESS
Solcast runs its own proprietary and globally consistent cloud detection system, using the highest spatial resolution satellite data available. The core input (see tables below) we use for detecting clouds from space is the imagery produced by geostationary meteorological satellites. The latest generation of satellites from NOAA, EUMETSAT and JMA (satellites in 5 different primary positions) produce scans of the Earth every 5 to 15 minutes at resolutions as fine as 500m. Theses satellites provide coverage anywhere on the globe, except Antarctica.
The raw imagery is first standardised on a satellite-by satellite basis so that the rest of the processing can be agnostic to the quirks of individual satellites. The imagery is georeferenced and projected onto a regular grid. The channels are converted to regular units. Visible channel data is converted from observed radiance to (bi-directional) reflectance, the fraction of reflected incoming radiation, which is independent of solar zenith during daytime periods. Infrared channel data is converted to brightness temperature, which is closely correlated to cloud-top temperature where there are clouds, and surface skin temperature elsewhere. Automated quality control is applied to catch imagery artefacts, such as swathes of empty data and striping, before they can corrupt downstream processing.
The standardised imagery is then converted into an uncalibrated initial estimate of cloud opacity. The visible channel reflectance is differenced with a pre-computed estimate of the clear-sky surface reflectance (based on a synthesis of recent past satellite imagery and other surface analyses including for snow presence and depth). This estimate is then further processed using information from a combination of IR imagery and NWP forecast data to account for confounding phenomena such as sun glint over tropical oceans, snow, salt pans, and other artefacts. Data are gap-filled across periods of satellite outages or bad satellite scans, using a combination of surrounding good satellite data and also weather reanalyses, in a combination that depends on the duration of the gap.
The cloud opacity estimate is then calibrated according to long-term historical comparisons to surface pyranometer data. As well as the initial uncalibrated estimate, the calibration is a function of solar position and satellite to account for small residual differences when standardizing the raw satellite imagery. This serves to minimize bias to the already low variance of the analysis cloud opacity.
AVOIDING OLDER, LESS RELIABLE SATELLITES
Because the quality of satellites and sensors was significantly lower prior to the mid 2000’s, we avoid using or providing data for dates prior to 2007. This provides a 12 year (and growing) record, which provides a long period at a higher level of certainty.
Prior to the mid 2000’s, even with the best quality control and algorithms, data is generally not sufficient for what we judge to be an acceptable level of quality in satellite derived irradiance estimates. The issues include: long data gaps (which some data suppliers fill using weather model data that is much lower precision and can cause bias), less frequent imagery resulting in undersampling, geolocation issues resulting in spatial errors, and a myriad of bad data artefacts that can silently affect accuracy of the resulting irradiance estimates.
Validation and Accuracy
Bias and error validation of Solcast data against surface measurements
During early and mid-2019, extensive analysis was performed comparing Solcast data with publicly available surface measurements from around the world, across all climate types except polar climates.
The internal Solcast analysis presented here can be referenced against a growing list of validation papers listed on the publications page. If you would like a copy of the validation timeseries data, a sample for one site is provided here on our website, and you are welcome to make a request for us to send you the data for all sites (be sure to tell us about your intended use case). This validation and accuracy information is correct to the best of our knowledge, but should not be interpreted as any form of guarantee or warranty. If you’d like help with further analysis of uncertainty at your specific site(s), please reach out to us to speak about a consulting study.
Site Selection
For validation of satellite-derived irradiance estimates, granular time series data from uniform, high quality, well maintained, long-period surface measurement sites are required. The Baseline Surface Radiation Network (BSRN) was selected to ensure the consistency of sensor specifications and the measurement calibration and quality control approach. A number of BSRN stations are equipped to measure solar and atmospheric radiation, using sensors of the highest available accuracy and a high sample rate. The BSRN network was set up specifically to provide high-quality observational data to the scientific community, making it ideal for validating satellite-based estimates of solar radiation. The use of a single, research-grade dataset for validation ensures the below statistics are of the highest possible quality and an accurate representation of the Solcast database.
Within the total set of BSRN stations, sites outside Solcast data coverage areas were excluded (i.e. removing oceanic and polar sites), and comparison was limited to sites with a sufficient record in time during the Solcast data availability period of approximately 12 years from 2007 (Solcast finds that prior to the mid-2000’s, satellite data was of substantially lower quality in general to warrant inclusion, even with quality control and other steps applied). Two mountain-top sites were excluded, Sonnblick, Austria (SON), and Izaña, Spain (IZA), which have extreme local topography that is not representative of solar development sites. Solcast data is not recommended for use in steep mountain terrain with local relief of more than 1000m.
Indicators
The most common statistical indicators in the solar industry used to evaluate solar radiation models fall into two categories; bias measures and error measures.
Bias measures
Bias measures are important for long term energy yield calculations, providing a base to estimate the accuracy of energy simulations by understanding a possible error in the long-term estimate. Mean bias error (MBE) provides information about the aggregate difference between the Solcast dataset compared against ground observations. It is a measure of the dataset’s systematic tendency to over- or underestimate the solar resource. Deviation of bias error indicates the spread of this error. It indicates the likelihood of the error at a specific site occurring within a confidence interval.
Error measures
Error measures are important for short term variability work. They help to develop an understanding of the accuracy of operational calculations based on energy simulations, covering recent performance and evaluation, equipment calibration, plant monitoring and forecasting. Mean absolute error (MAE) measures the average magnitude of the difference between the ground station and the models. Root mean squared error (RMSE) is another measure of these differences, but uses quadratic weighting. This means larger errors have a disproportionately larger effect on RMSE, and consequently this measure is very sensitive to large errors.
Results Overview
The following tables present the global total summary statistics of the Solcast dataset compared to the surface measurements, at the hourly average time granularity.
- Global bias statistics - Hourly GHI :
- Mean bias error (MBE) : -0.02 W/m2
- Relative mean bias error (rMBE) : 0.00%
- Standard deviation of bias error : ±2.02%
- 80% of sites have bias smaller than : ±1.93%
- 90% of sites have bias smaller than : ±2.50%
- Global mean error statistics - Hourly GHI :
- Mean absolute error (MAE) : 47.44 W/m2
- Relative mean absolute error (rMAE) : 10.89%
- Root mean square error (RMSE) : 72.38W/m2
- Relative root mean square error (rRMSE) : 16.5%
- Correlation coefficient : 0.91
Customer reviews
No reviews were found for Solcast - Historical and TMY Software. Be the first to review!