

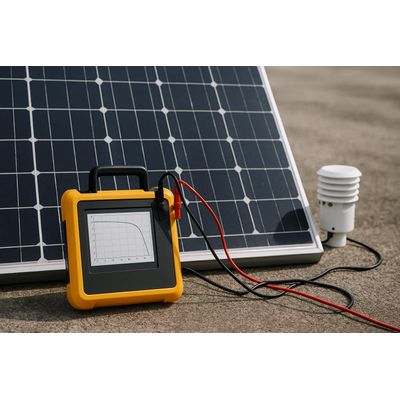
PV Module IV Curve: A Definitive Guide to Understanding Solar Performance
PV module IV curve is a powerful diagnostic tool for understanding how a photovoltaic module actually performs under real-world conditions. It shows how current and voltage interact and helps verify system health, detect performance losses, and support reliability assessments for engineers, O&M teams, EPCs, and asset owners.
This guide explains what a PV module IV curve is, how to interpret it, what it reveals about system behavior, and why accurate environmental measurement is essential for meaningful analysis.
What is a PV module IV curve?
A PV module IV curve (current–voltage curve) graphs the electrical behavior of a photovoltaic module under illumination. It is a cornerstone of solar performance diagnostics across the PV system lifecycle. The characteristic shape arises from physical processes inside the solar cell: absorbed photons generate electron–hole pairs, and an internal electric field drives current. At low voltages, current is limited by resistive effects; as voltage increases, recombination limits current until it falls to zero at open-circuit voltage (Voc).
The curve plots current (I) on the vertical axis and voltage (V) on the horizontal axis. It is generated by sweeping the electrical load from open circuit to short circuit (or vice versa) and recording all possible operating points. Under standard test conditions (STC) of 1000 W/m² irradiance, 25 °C cell temperature, and AM 1.5 spectrum, the IV curve defines the module’s rated electrical characteristics. In the field, IV curves shift continuously with irradiance, temperature, and operating conditions.
Because of this sensitivity, IV curves are used in manufacturing, certification, commissioning, and targeted diagnostics to validate performance and reliability.
Key parameters of a PV module IV curve
- Short-circuit current (Isc) – the maximum current when voltage is zero. Isc is directly proportional to irradiance and reflects usable sunlight reaching the module.
- Open-circuit voltage (Voc) – the maximum voltage when current is zero. Voc is highly temperature dependent and provides insight into cell behavior and degradation.
- Maximum power point (MPP) – the point of maximum product of voltage and current: Pmax = Vmp × Imp. This is the target for inverters and MPPT algorithms.
- Fill factor (FF) – a dimensionless metric: FF = Pmax /(Voc × Isc). Typical high-quality crystalline silicon modules exhibit FF 70–85%. A reduced FF indicates resistive losses, mismatch, or degradation.
Interpreting FF requires consideration of series and shunt resistance, as increases in series resistance or decreases in shunt resistance reduce FF and overall module efficiency.
Environmental influence on the IV curve
A module IV curve is not static. Its shape and position shift with environmental conditions. Irradiance primarily affects Isc; lower irradiance compresses the curve vertically, while the shape remains similar when measurement accuracy is maintained. Temperature mostly affects Voc; higher temperatures reduce voltage and overall power. Soiling and partial shading distort the curve, activate bypass diodes, and reduce FF and power output. Accurate irradiance and temperature measurements are essential for correct interpretation, as unreliable environmental data can mask true performance variations.
Degradation primarily affects Pmax and FF, driven by environmental exposure and electrical loading.
What IV curve reveals about system performance
Beyond basic definitions, IV curve analysis enables diagnostics not always evident from aggregate metrics. It supports identification of soiling losses, detection of partial shading and mismatch, early warning of degradation trends, validation of commissioning quality, and differentiation between environmental effects and true faults. In fleets, population-level IV analysis isolates underperforming modules before yield losses escalate.
Common IV curve signatures and their implications
- Low Isc – Soiling, shading, reduced irradiance; implies reduced power output.
- Low Voc – High temperature or cell damage; can indicate voltage clipping.
- Rounded knee (low FF) – Series resistance or degradation; reduces Pmax.
- Stepped curve – Bypass diode activation; causes intermittent losses.
- Compressed voltage leg – Cell mismatch or microcracks; signals potential long-term degradation.
Under non-uniform soiling or partial shading, Pmax losses are not necessarily proportional to Isc losses, making full IV curve analysis essential for accurate assessment.
Measurement best practices
- Stable irradiance conditions, typically above 600 W/m².
- Simultaneous measurement of irradiance and temperature.
- Normalization to reference conditions for meaningful comparison.
- Traceable sensor calibration to minimize uncertainty.
Measurement quality determines IV curve confidence. Sensor drift, angular mismatch, or poor temperature correction can distort curves, leading to misinterpretation. Reference-grade irradiance measurement and well-maintained sensors support credible IV analysis and data-driven decisions.
Applying IV Curve Analysis at scale
As PV portfolios scale, IV curve analysis provides consistent performance assessment across strings, arrays, and fleets. It enables earlier detection of systemic issues, clearer differentiation between environmental effects and true faults, and improved long-term performance tracking. When combined with traceable environmental measurements, IV curves support repeatable, fleet-level insights that inform operations and performance modeling over the system lifecycle. Key aspects include:
- Population-level analysis – comparing IV curves across large module populations to identify systematic issues.
- Bifacial considerations – rear-side irradiance affects Isc and curve shape; requires measurement of front and rear plane-of-array conditions.
- IV curves and performance ratio (PR) – IV curves explain why performance changes occur, complementing PR analysis.
FAQs
- What causes steps in a PV module IV curve? Partial shading activates bypass diodes, creating stepped plateaus along the curve.
- What is a good fill factor for PV modules? Typically, above 80% for high-quality monocrystalline modules under STC.
- Can IV curves detect degradation? Yes. Long-term trends in Voc, FF, and curve shape reveal gradual degradation patterns.
- How often should IV curves be measured? Commonly during manufacturing, commissioning, and targeted O&M diagnostics.
Understanding a PV module IV curve is the first step. Applying it consistently across modules, strings, and fleets requires accurate measurement, reliable interpretation, and confidence in the data behind each curve. Practical guidance and tools help teams move from IV curve understanding to data-driven performance assessment.
Original: https://blog.otthydromet.com/en/what-is-a-pv-module-iv-curve-a-guide-to-understanding-solar-performance/