

- Home
- Companies
- HUAZHENG Electric Manufacturing ...
- Products
- HUAZHENG - Model HZCR-5100 - 3 Phase ...
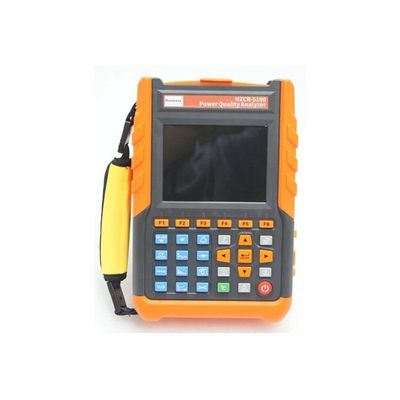
HUAZHENG - Model HZCR-5100 -3 Phase Power Quality & Energy Analyzer
The power quality analyzer is a three-phase, multi-functional, intelligent, and simple man-machine operation comprehensive testing instrument specially developed by our company for on-site testing. It has the characteristics of easy to use, super large LCD color screen display, high resolution, Chinese and English bilingual operation interface, and anti-vibration structure shell. It is suitable for electric power, petrochemical, metallurgy, railway, industrial and mining enterprises, scientific research institutions, measurement departments, etc. It is especially suitable for comprehensive analysis and diagnosis of all electrical parameters such as voltage, current, power, electric energy, harmonics, and phase.
Basic functions:
Real-time display of waveforms (4 voltages/4 currents).
Voltage and current true rms.
DC component of voltage.
current and voltage peaks.
Maximum/minimum value of current and voltage half cycle rms.
The phasor diagram is displayed.
Measurement of harmonics of each phase, up to the 50th harmonic.
The bar graph shows the harmonic content rate of each phase current and voltage.
Total Harmonic Distortion (THD).
Each phase active/reactive/apparent power value and total value.
Active/reactive/apparent energy value and total value of each phase.
Transformer K factor.
Power Factor (PF) and COS φ Displacement Power Factor (DPF).
Short-term voltage flicker.
Three-phase unbalance (voltage and current).
CT ratio function.
2.2 Capturing record function:
Transient capture function :
It can capture and detect instantaneous changes of grid voltage and current parameters, including voltage and current fluctuations, voltage and current sudden rises, sudden drops, short-term interruptions, transient overvoltages, inrush currents, and instantaneous current and voltage distortions. The instrument can store up to 150 sets of transient waveforms at the same time.
Starting current monitoring:
It can monitor the surge current of the line and the starting current when the electrical equipment is started, which is helpful for the correct design of the installed capacity. It can display the rising/falling curve of the effective value during the starting process, the envelope curve of the starting current, 4 currents and 4 voltage waveforms. It can record about 100s after being triggered, and store all the instantaneous values of current and voltage and waveform curves in each cycle within 100s.
Trend chart record storage function:
All test parameters of basic test functions (Urms, Uthd, Ucf, Uunb, Hz, Vrms, Vthd, Vcf, Vunb, PST, Arms, Athd, Acf, Aunb, KF, W, VAR, VA, PF, COS φ , TAN φ ), the 50th harmonic of the voltage, the 50th harmonic of the current, a total of 123 parameters are recorded, and a trend graph is generated, and long-term data recording can be performed as required. (Choose 20 parameters at the same time to record once every 1 second, about 960 days can be recorded)
Alarm function:
According to the needs, you can set the limit value for the selected parameter, monitor whether it exceeds the limit, and generate an alarm log when it exceeds the limit, such as voltage overvoltage, current overcurrent, unbalance exceeding limit, certain harmonic ratio exceeding limit, frequency exceeding limit, active power overrun, total harmonic distortion overrun, etc., up to 40 groups of alarm monitoring parameters can be set, and each group can set different monitoring parameters (including 50 harmonics, a total of 123 different parameters) and limit values , you can set the minimum time for exceeding the limit. Up to 12800 groups of alarm log records can be stored.
Screen capture function:
On any test page, the current screen can be saved as a screenshot, and the recording time and test mode are automatically saved at the same time. For example, screen pictures of current and voltage waveforms, harmonic histograms, phasor diagrams, etc. can be saved. Up to 60 groups of screenshots can be saved at the same time.
2.3 Other functions
Communication function:
The monitoring software can communicate with the computer through USB, and the monitoring software can display the waveform of the power quality analysis test in real time, and can read the detected and captured transient waveforms, trend graph records, alarm logs, screenshots, etc., and display them on the computer.
Setup function:
The user can set the time and date, set the contrast and brightness of the display screen, and set the corresponding colors of the waveform curves of each phase in the instrument.
The wiring mode and grid type of the instrument can be set.
Different current clamps and different voltage test ratios can be selected.
Chinese menu or English menu can be selected.