- Home
- Companies
- Explicit ApS
- Products
- Explicit - Flare Efficiency Measurement ...
Explicit - Flare Efficiency Measurement System
A new highly accurate drone-based method of measuring the destruction removal efficiency (DRE) of flares. Sniffer drone tech enhances flare monitoring for sustainability. Developed by Explicit, the method uses a sniffer drone integrated with high performance gas and wind sensors. Flare destruction removal efficiency plays a crucial role in reducing environmental impact. By implementing precise monitoring practices, efficiency can be enhanced to meet regulatory requirements, and take proactive steps towards sustainable environmental management.
- Easy deployment over land and sea
- Single-person set up
- Independendency from mean wind
- No interference with site operations
- High accurancy and low detection limit
- ISO accredited method, patented technology
Site survey & sampling plan
Preliminary analysis of the site: identification of possible sources, risk zones, feasible flight paths etc. Organization of the campaign.
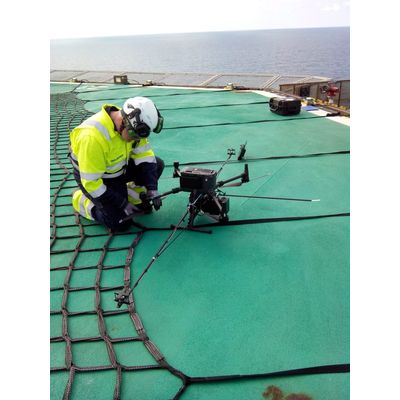
Drone set-up and data collection
Gas and wind sensors are integrated to the drone. Through an adaptive flight pattern, the drone flies a vertical wall downwind from the site of interest, collecting thousands of data points.
Preliminary and final analysis
An automatized analysis provides the pilot real-time feedback on the flight.
Once the data collection is concluded, the analyst processes the data. Using the client's data, flow rate and gas concentration, the Flare Destruction Removal Efficiency assessment is created.
Emission report
A detailed emission report containing the average emission rates and flare destruction efficiency is presented to the client.
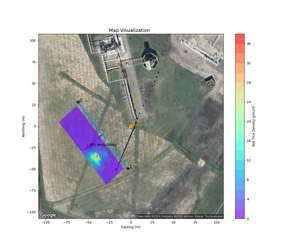
Data are collected downwind from the site of interest, so that the emission plume is entirely intercepted by the drone. Because both gas and wind data are closely correlated in time and space, Explicit is able to accurately calculate the net emission rate (kg/h) across the inspected area for both CO2 and methane and thereby calculate the DRE.

- Biogas plants
- Oil and gas sector
- Waste water treatment plants
The flight flux density visualization is plotted on the site map, together with the average wind direction estimated during the flight (orange lines). These visualizations are presented in the emission report.