

- Home
- Companies
- Memoori Business Intelligence Ltd
- Services
- The Smart Grid Business 2011 to 2016

The Smart Grid Business 2011 to 2016
This report is the definitive resource for Smart Grid Research, combining clearly defined Market Sizing Statistics with Financial Analysis of M&A and Investment.
- Get valuable information about the size and structure of the Smart Grid business. What is the forecast demand for Smart Grid products to 2016?
- Understand valuations and exit multiples paid for Smart Grid companies. What is driving M&A in this business?
- Use the detailed research to make informed strategic marketing & investment decisions.
Within its 182 pages and over 24 charts and tables, the report sieves out the facts and draws conclusions as to what is shaping the future of the Smart Grid industry;
- We estimate that to achieve full penetration of the world’s existing grid together with future extensions to 2030; will require an investment of some $2 trillion on pure Smart Grid equipment at installed prices.
- There are currently at least 1,700 companies in the world manufacturing hardware and software products for the electrical transmission and distribution market which have annual sales of over $5 million per annum. Of these, companies having annual sales of over a $1 billion account for 65% of the business but only 1% by number.
- Total spend on power transmission & distribution equipment in 2010 was some $106 billion and is forecast to rise 5.3% per year through 2013 to $124 billion.
- We estimate that the sales of Smart Grid systems were $16 billion in 2010 and this clearly shows that the business is still in its embryonic stages. It is also very unbalanced because the current share taken by smart meters is running at over 30% of the market.
- In the space of 5 years mergers and acquisitions have grown from $134 million in 2007 to $10.6 billion in 2011. Both the growth and now scale indicate the supply side is gearing up to meet the requirements of new technology and forecast demand for pure Smart Grid products and systems.
- VC Companies invested some $1 billion per year in 2010 and 2011 in Smart Grid supplier companies. They have recouped some investments through 3 major IPO’s during that time. So far most other private equity investors have stayed away from the acquisition dealing tables.
For only USD $999 for a single user license or USD $1,499 for a company license, this report provides valuable information into how Smart Grid companies might develop their business through merger, acquisition and alliance.
The information contained in this report will be of value to all those engaged in managing, operating and investing in Smart Grid companies (and their advisors) around the world. It is specifically aimed at sales, marketing and strategic planning professionals who want to understand the part being played by merger, acquisition and alliance in the market. It will also be useful to investors who need information on the impact of technology on the structure of this business and those players in the market who want to identify growth sectors and investment opportunities.
- Preface
- Executive Summary
- Introduction
- Size, Structure Shape of the Business
- 2.1 Structure & Shape of the Business
- 2.2 State of the Market
- Market Size – Electrical Generation, Transmission & Distribution Equipment
- 3.1A Global Market
- 3.1.1 World Generation Capacity – Identifying the Largest Potential Markets
- 3.1.2 World Renewable Power Capacity – Identifying the Best Potential Markets
- 3.1.3 World Power Transmission & Distribution Equipment Sales 2010
- Pure Smart Grid World Market Size 2010 & Potential Size to 2030
- 4.1 Total Potential World Investment at Full Penetration
- 4.1.1 Potential Size of Smart Grid World Market by Country
- 4.1.2 Potential Size of the Smart Grid Market by Country & Product Grouping
- 4.1.3 Innovation is the Key to Smart Grid Growth
- 4.1.4 Government Support Initiatives – Carrot or Stick?
- 4.2 Market Size by Product & Country, Forecast to 2030
- 4.2.1 Market Size – Transmission Systems
- 4.2.2 Market Size – Distribution Systems
- 4.2.3 Market Size – Advanced Metering Infrastructure Networks
- 4.2.4 Market Size – Consumer Interfaces, HAN, EMS, Storage & EV’s
- 4.2.5 Market Size – Communication Networks
- 4.2.6 Market Size – Analytics, Enterprise & Security Software
- 4.2.7 Smart Grid Cyber Security Expenditure
- Strategy – Business Models & Routes to Market
- 5.1 Strategy & Business Models
- 5.2 Routes to Market
- 5.2.1 Expect Changes to Traditional Trading Practices & Channels of Distribution
- Drivers, Barriers and the Implementation of New Technologies
- 6.1 Smart Grid Drivers
- 6.1.1 Now must be the Time to Focus on Bringing it all Together
- 6.1.2 Trouble with Nuclear Power Reinforces the Need for Smart Grid
- 6.1.3 Can Current Technology Deliver a Smart Grid?
- 6.1.4 Regional Variations
- 6.2 Road Blocks that will slow down Smart Grid Development
- 6.2.1 Stuck between a Financial Rock and an Economic Hard Place
- 6.2.2 Smart Grid Strategy needs better Balance and a Rethink on Priorities
- 6.3 Regulatory Bodies & Policy Frameworks
- 6.4 Smart Grid Communications – Analytical & Security Software
- 6.4.1 Communications
- 6.4.2 Security
- 6.5 Accommodating Renewables & the Importance of Storage
- 6.6 Distributed Energy – Micro-Grids & Micro-Generation
- 6.7 Interfacing Smart Grid & Micro-Grid with Energy Management Systems & HAN
- 6.7.1 Home Area Networks (HAN)
- 6.7.2 Energy Management Systems (EMS)
- M&A Performance & Valuations in 2011 – Forecast to 2016
- 7.1 The Progress of Consolidation & Outlook to 2016
- 7.1.1 Consolidation in 2011 Outperformed Any Previous Year
- 7.1.2 Forecast of Merger & Acquisition Business to 2016
- 7.2 Valuation – Exit Multiples 2005 to 2011
- 7.2.1 Performance of Exit Multiples 2005 to 2011
- Analyzing M&A Strategy
- 8.1 Consolidation is Critical for the Development of Smart Grid
- 8.2 How did Consolidation Shape Up in 2010 & 2011?
- 8.2.1 Reviewing the Top 5 Acquisitions in 2010 & 2011
- 8.2.2 The Top 5 Acquisitive Companies of 2010 & 2011
- 8.2.3 M&A Analyzed by Business Segment 2010 & 2011
- 8.2.4 Internal Strategic Buys
- 8.2.5 External Strategic Buys
- 8.2.6 IPO’s & Private Equity
- The Investment Market
- 9.1 The State of the Investment Business & Exposure to the Smart Grid Industry
- 9.1.1 Impact on the Smart Grid Industry
- 9.2 Investors in the Smart Grid Industry & Recipients
- 9.3 Government Assistance & Stimulus Grants
- 9.3.1 Government Funding – An Important Driver of Growth
- Identifying Potential Merger & Acquisition Targets & Entry through Alliance
- 10.1 Potential Acquisition Targets
- 10.2 Alliance – The Precursor of Merger & Acquisition
Appendix
- A 1.1 – Listing of Venture Capital Companies & Their Security Investments
- A 1.2 –Acquisitions & Funding Announced in 2010 / 11
- A 1.3 – Potential Acquisition Targets 2010 / 11
- A 1.4 – World’s Major Security & Safety Companies
List of Charts and Figures
- Fig 2.1 –Average Revenue for Group A, B & C Companies ($m)
- Fig 2.2 –Distribution of Sales by Major Grouping by Value
- Fig 2.3 –Distribution of Sales by Major Grouping by Number of Companies
- Fig 3.1 – Electrical Power Generating Capacity by Country (Gigawatts) 2008
- Fig 3.2 – Worlds Largest Producers of Electricity through Wind Power 2009 / 2010
- Fig 3.2 – World Electric Power Transmission & Distribution Equipment 2010 ($b)
- Fig 4.1 – Smart Grid World Investment at Full Potential ($ bn)
- Fig 4.2 – World Investment in Smart Grid to Achieve Full Penetration by 2030
- Fig 4.3 – Smart Grid Investment Potential by Country and Product Sector at Installed Prices ($ mn)
- Fig 4.4 – Pure Smart Grid Sales by Country 2010 & Forecast to 2030
- Fig 4.5 – World Smart Grid Sales for the Transmission Networks 2010 and Forecast to 2030
- Fig 4.6 – World Smart Grid Sales for the Distribution Network 2010 and Forecast to 2030
- Fig 4.7 – World Smart Grid Sales for AMI 2010 and Forecast to 2030
- Fig 4.8 – World Smart Meter Installations by Region 2011 & Forecast to 2016
- Fig 4.9 – World Smart Grid Sales for Consumer Interface 2010 & Forecast to 2030
- Fig 7.1 – Smart Grid Deals Completed from 2007 to 2011
- Fig 7.2a – Smart Grid Deals by Value & Forecast to 2016
- Fig 7.2b – Smart Grid Deals by Volume & Forecast to 2016
- Fig 7.3 – Acquisition Valuation Benchmarks 2006 – 2012
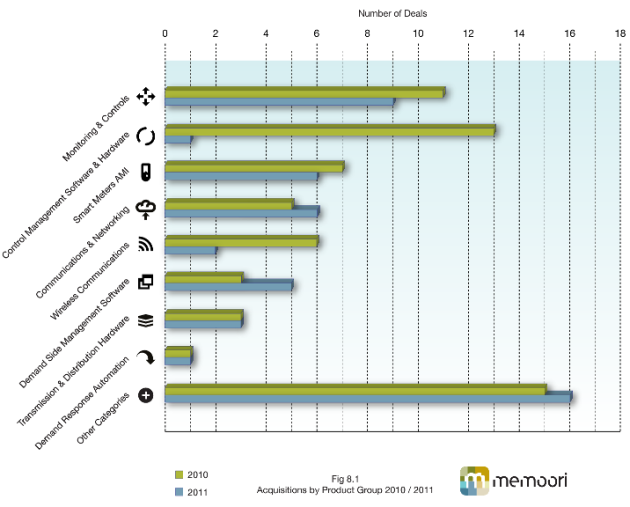
- Fig 8.1 – Acquisitions by Product Group 2010 / 2011
- Fig 9.1 – VC Funding in Smart Grid
List of Tables
- A 1.1 – Venture Capital Investment in Smart Grid Companies
- A 1.2 – M&A Activity & Deals Involving Smart Grid Companies
- A 1.3 – Potential Acquisition Targets 2011
- A 1.4 – The World’s Major Smart Grid Companies