
- Home
- Companies
- Giatec Scientific Inc.
- Software
- Giatec - Version 360 - An Advanced ...
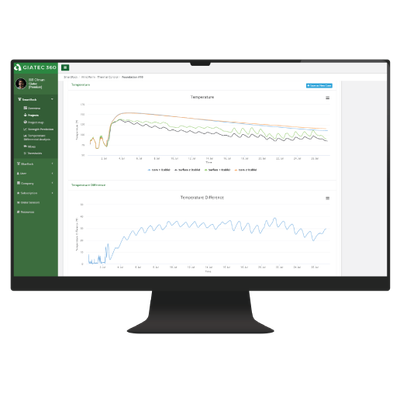
Giatec - Version 360 -An Advanced Cloud-Based Dashboard for Monitoring and Managing Concrete Pours
The Giatec 360 cloud-based dashboard for monitoring concrete pours is the next level in data analytics, reporting, and user management capabilities for your SmartRock sensors. These user-friendly sensors are easily installed in the concrete formwork (on the rebar) before pouring to monitor your concrete’s in-place temperature and strength in real-time. The sensor data is accessible wirelessly in the free SmartRock app or remotely with the SmartHub™ device. As a desktop extension of the app, your information is synced on the Giatec 360 dashboard giving you access to numerous features that provide more insights into your projects than ever before. Now available in multiple languages like English, French, Spanish, Swedish, Icelandic and many more to come.
- Manage user access levels and protect sensitive project data,
- Monitor multiple projects at the same time,
- Plot data between multiple sensors,
- Organize projects by section/pour,
- View user activity logs and connected devices,
- Generate PDF/CSV and other reporting options to make fast and efficient decisions,
- And all upcoming features.